Boston Real Estate Market Reports
Boston Home Prices and Trends Boston Area Real Estate Market Report
Downtown Wide Report Below- Market Reports Main
- Back Bay
- Beacon Hill
- South End
- Seaport District
- Waterfront
- Midtown/Downtown
- South Boston
- Jamaica Plain
- Charlestown
- Leather Dist.
- Dorchester
- Roxbury
- East Boston
- Fenway
- North End
- West End
- Brighton
- Arlington
- Brookline
- Cambridge
- Lexington
- Milton
- Newton
- Somerville
- Quincy
- Watertown
- Wellesley
- Weston
BOSTON REAL ESTATE MARKET ACTIVITY: CORE DOWNTOWN NEIGHBORHOODS
*Core downtown neighborhoods as defined for the purpose of this section: Back Bay, Beacon Hill, South End, Midtown/Downtown, Seaport, Waterfront, Leather District, Charlestown, South Boston, Fenway, Roxbury, JP, Dorchester, West End, Bay Village, Chinatown.
May 2025 vs 2026: Condos and Single Family Homes (Source: MLS-PIN and LINK)
Condos and Single-Family Homes
Going Under Agreement (Pending) 6/15 to 7/15
vs. Supply on 7/15
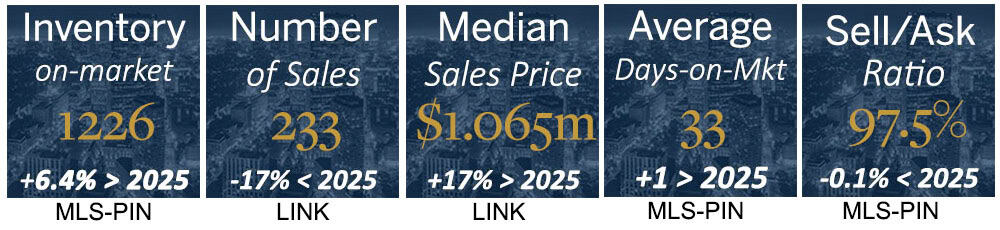
Sales activity in the downtown Boston real estate market is up 3.41% from last year during this period.
Listings are up 10.56% from last year on this date.
From MLS-PIN
Core Boston neighborhood condominiums going under agreement (MLS-PIN)
Median core Boston neighborhood condo and home prices (LINK)
In thousands
You can see periodic spikes in median sales price. These are due to closings at large luxury buildings.
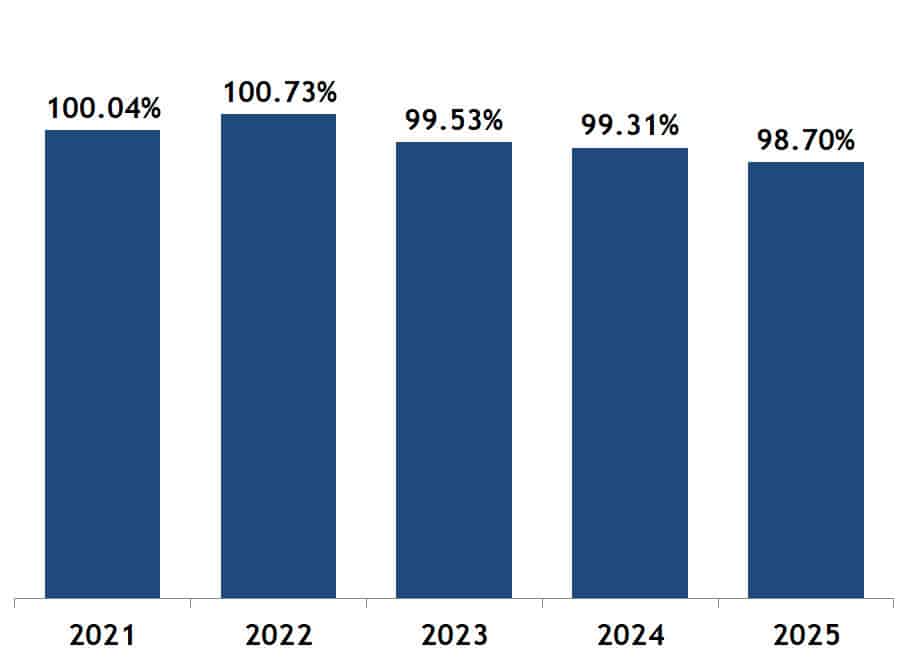
Core Boston Neighborhood Condominium Absorption Rate
- The number of properties available vs. the number of condos going under agreement/pending in the last 30 days.
- Expressed in "months of supply." Determines whether there is upward or downward pressure on prices.
- A 4+- month supply considered a balanced market. Above that, there is downward pressure on prices, and below that there is upward pressure.
- While sales activity has lessened, there are also fewer condos on the market, driving prices up despite the 4+ months of supply.
| 7/15/2019 4.13 Months |
7/15/2020 4.01 Months |
7/15/2021 2.90 Months |
7/15/2022 4.27 Months |
| 7/15/2023 3.82 Months |
7/15/2024 4.46 Months |
7/15/2025 5.92 months |
7/15/2026 6.33 Months |
Year-to-Date Real Estate Market Review: Core Downtown Boston Neighborhoods
Days on Market Year-to-date (Condos, single family, all price ranges):
Thru 7/21/2025
45 Days
Thru 7/21//2026
45 Days
Median sales prices (Condos, single family, all price ranges):
Thru 7/21/2025
$999,000
Thru 7/21/2026
$1,125,000
Change
+ 13.07 %
Number of closed home sales (Condos, single family, all price ranges):
Thru 7/21/2025
1473
Thru 7/21/2026
1435
Change
- 2.58%
$ per square foot (Condos, single family homes all price ranges):
Thru 7/21/2025
$1,097/SF
Thru 7/21/2026
$1,172/SF
Change
+ 6.84%
Luxury Real Estate, Year-to-Date: Core Downtown Boston Neighborhoods
Number of closed sales (Condominiums, single family homes) $2m+ :
Thru 7/21/2025
264
Thru 7/21/2026
315
Change
+ 19.32%
Number of closed sales (Condominiums, single family homes) $4m+ :
Thru 7/21/2025
70
Thru 7/21/2026
92
Change
+ 31.43%
See above commentary. More luxury property market details.
Greater Boston Unemployment Rate:
As of July 22, 2026, the latest month for which final figures are available for Boston is May 31, 2026
May 2772
4.40%
May 2026
4.10%
Change
- .30%
Interest Rate (APR) as of June 2, 2026:
30 yr. fixed conventional
6.490% APR (0 points, $1,236 in upfront costs);
Based upon a $550k purchase
30 YR. fixed jumbo
6.388% APR (0 points, $1,395 in upfront costs);
Based on a $1m purchase
5/1 yr jumbo or conventional ARM
5.875% APR (no data available on points and upfront costs);
Based on a $1m purchase
All based on a 780+ credit score, with 20% down.
For condos & single family homes sold annually, metro Boston:
* Boston, Newton, Brookline, Cambridge, Somerville, Arlington, Watertown
May 2025 vs 2026: Condos and Single Family Homes (Source: MLS-PIN)

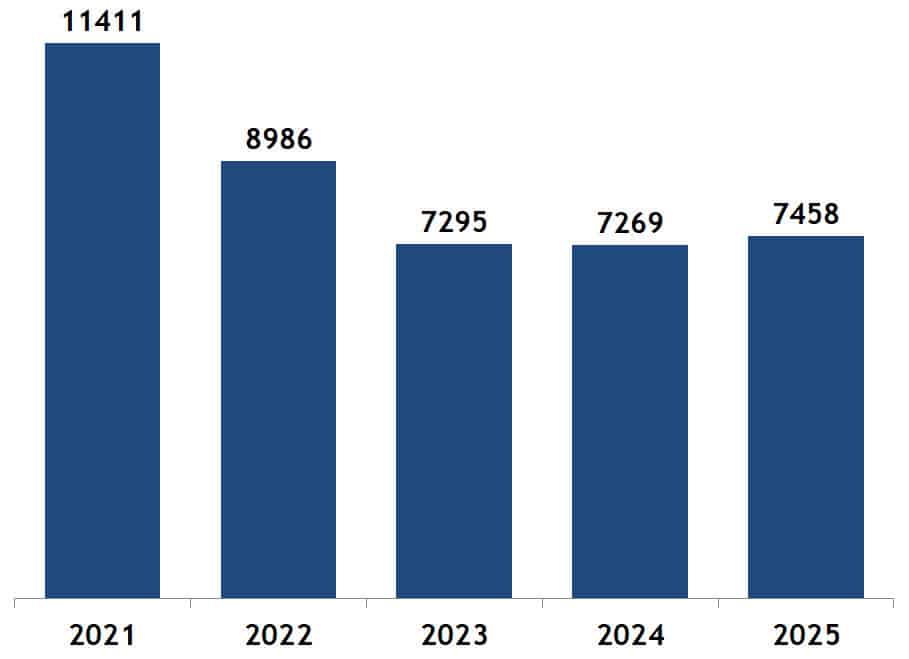
Metro Boston: Properties Sold (per year)
Source: MLS-PIN
Metro Boston: Median Selling Price (per year)
Source: MLS-PIN
Metro Boston: Days to Accepted Offer (per year)
Source: MLS-PIN