Boston Home Sales

The Surprising Amount of Home Equity You've Gained over the Years

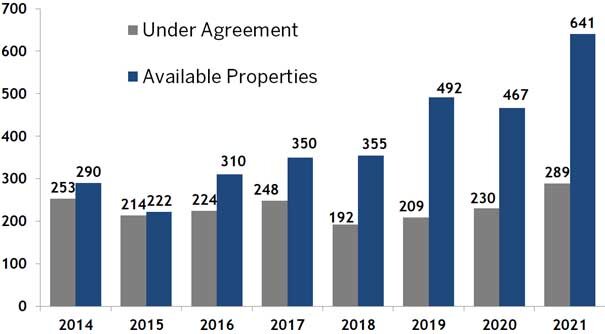
There are a number of reasons you may be thinking about selling your house. And as you weigh your options, you may find you’re unsure how you’re going to deal with one thing about today’s housing market – and that’s affordability. If that’s your biggest concern, understanding how much equity you have in your house could help make your decision that much easier. Here are two key factors that have a big impact on your equity.

How Long You’ve Been in Your Home

First up is homeowner tenure. That’s how long homeowners live in a house, on average, before selling or choosing to move. From 1985 to 2009, the average length of time homeowners stayed put was roughly six years. 

But according to the National Association of Realtors (NAR), that number has been climbing. Now, the average tenure is 10 years (see graph below):

No Caption ReceivedHere’s why that’s such a big deal. You gain equity as you pay down your home loan and as home prices climb. And when you combine all of your mortgage payments with how much prices have gone up over the span of 10 years, that adds up. So, if you’ve lived in your house for a while now, you may be sitting on a pile of equity.

How Home Prices Appreciate over Time

To help show how much the price appreciation piece adds up, take a look at this data from the Federal Housing Finance Agency (FHFA) (see graph below): 

No Caption ReceivedHere’s what this means for you. While home prices vary by area, the typical homeowner who’s been in their house for five years saw it increase in value by nearly 60%. And the average homeowner who’s owned their home for 30 years saw it more than triple in value in that time.

Whether you’re looking to downsize, relocate to a dream destination, or move so you can live closer to friends or loved ones, your equity can be a game changer. If you are curious about how much equity you’ve built up over the years and how you can use it to buy your next home, let’s connect.

Joe


Mortgage and Housing Update 9/22/2024

Housing, interest, mortgage Fed reports

Week Ending 9/22/2023

Fed Projections

From the Joe Smith Team at Cross Country Mortgage
At the highly anticipated meeting on Wednesday, Fed officials confirmed their outlook for short-term rates to remain at elevated levels for quite a while. While this was not much of a surprise, the news caused mortgage rates to climb to their highest levels in decades.


As expected, the Fed made no change in the federal funds rate, and the statement released after the meeting was very similar to the prior one. The key information was the latest set of projections from officials for future monetary policy. First, the median forecast from 19 Fed officials is for an additional 25 basis point rate hike this year. In addition, they anticipate that the federal funds rate will remain near current levels for a substantially longer period of time than in the last set of projections released three months ago. The bottom line is that officials currently do not see rate cuts coming as soon as investors expected. According to Chair Powell, they want to see "convincing evidence" that inflation is on track to return to target levels before loosening monetary policy.

In housing news, sales of existing homes in August fell slightly from July and were 15% lower than last year at this time. Inventory levels stand at just a 3.3-month supply nationally, far below the 6-month supply typical in a balanced market. The median existing-home price of $407,100 was 4% higher than last year at this time.

There is no doubt that additional inventory of homes available for sale continues to be desperately needed, but the latest data contained mixed news. Overall housing starts in August were disappointing with a larger than expected decline of 11% from July to the lowest level since June 2020. Most of the weakness came from the multi-family sector, however, with just a modest drop in single-family units. More encouragingly, building permits, a leading indicator, increased for both single-family and multi-family units. Builders again cited tight credit conditions for loans and high prices for land, labor, and materials as obstacles to a faster pace of construction.

Week ahead

Investors will continue to watch for Fed officials to elaborate on their plans for future monetary policy. For economic reports, Consumer Confidence and New Home Sales will be released on Tuesday. Personal Income and the PCE price index, the inflation indicator favored by the Fed, will come out on Friday.


Tue

9/26

New Home Sales

Tue

9/26

Consumer Confidence

Fri

9/29

Core PCE

Fri

9/29

Personal Income


Mortgage Rates

Rose

0.15%

Dow

Fell

500

NASDAQ

Fell

400


Joe Smith
Branch Manager / SVP
M 617-308-3337
D 617-236-1555
W crosscountrymortgage.com/the-joe-smith-team
E jsmith@ccm.com

We would like to thank our partner, MBSQuoteline for their insightful information.

All material Copyright © Ress No. 1, LTD (DBA MBSQuoteline) and may not be reproduced without permission.


Today's Housing Inventory Is a Sweet Spot for Sellers


One of the biggest challenges in the housing market right now is how few homes there are for sale compared to the number of people who want to buy them. To help emphasize just how limited housing inventory still is, let’s take a look at the latest information on active listings, or homes for sale in a given month, as it compares to more normal levels.

According to a recent report from Realtor.com

 “On average, active inventory in June was 50.6% below pre-pandemic 2017–2019 levels.”

The graph below helps illustrate this point. It uses historical data to provide a more concrete look at how much the numbers are still lagging behind the level of inventory typical of a more normal market (see graph below):

It’s worth noting that 2020-2022 are not included in this graph. That’s because they were truly abnormal years for the housing market. To make the comparison fair, those have been omitted so they don’t distort the data.

When you compare the orange bars for 2023 with the last normal years for the housing market (2017-2019), you can see the count of active listings is still far below the norm.

What Does This Mean for You? 

If you’re thinking about selling your house, that low inventory is why this is a great time to do so. Buyers have fewer choices now than they did in more normal years, and that’s continuing to impact some key statistics in the housing market. For example, sellers will be happy to see the following data from the latest Confidence Index from the National Association of Realtors (NAR):

  • The percent of homes that sold in less than a month ticked up slightly to 74%. 
  • The median days on market went down to 18 days, showing homes are still selling fast when priced right. 
  • The average number of offers on recently sold homes went up to 3.3 offers.

When supply is so low, your house is going to be in the spotlight. That’s why sellers are seeing their homes sell a little faster and get more offers right now. If you’ve thought about selling, now’s the time to make a move. Let’s connect to get the process started. 

My Thoughts on the Boston Real Estate Market

That’s when the Federal Reserve started tightening the screws, ending our sugar high of historically low interest rates in an attempt to get a hold on inflation. The post-covid-lockdown period has certainly come with a variety of challenges and uncertainty.

As we start to transition into this period, it’s worth asking what the housing market is transitioning to.

Do you think it could be...normal?

3% interest rates are certainly not normal. Having 50 buyers bid on a house is not normal (as nice as it was for sellers).

I’m not trying to say that high interest rates are a good thing.

But what, historically, is a high interest rate? 5%? 6%? Is even 7% a high rate? Not historically. Just for perspective, I’ve got folks in my office who laugh and tell me, “I bought my first place at 18%!” (BTW, that's most assuredly not normal either).

Here is a link to the history of mortgage rates over the last 50 or so years

Even at higher interest rates, the sky will not fall. Sellers will still be getting a nice return on their home. Buyers will not have to get into ridiculous bidding wars over homes. There is no bubble to burst.

Will a recession come? Maybe not tomorrow or even this year, but...Yes! They always do!

Here's my recession story: I bought my previous home in August of 2008. I paid $640,000. In 2010, in the middle of a historic economic meltdown, the unit next door to mine, essentially the same unit, sold for $575,000. In 2020, I sold my unit for $1.1m.

Let’s get a grip on what we have here in the Boston area: A super-strong economy with varied industries creating thousands of jobs. A vibrant city that is the envy of most of the rest of the country.

Over the last decades, Boston real estate has been a super investment.

Even in the 2009 meltdown, we saw minimal losses and a vibrant recovery. At this time, our market is much healthier. Home equity far surpasses what it was then. The average credit rating of current mortgage borrowers is significantly higher. The structural problems in the mortgage industry have been mitigated to a high degree.

And one more thing: Inventory. Levels of inventory here over the last 20 years or so have been low relative to most other markets. Absorption rates reflecting low levels of inventory, the envy of most other locations in the country, remain remarkably steady, even in relatively hard times, aside from a few spikes. As of June 15th, 2022, we had only 2.44 months of inventory in our downtown neighborhoods. For the same period of 2020 as we were emerging from Covid lockdown, we had 2.94. During 2009-10, they were higher, but nothing approaching the levels of unsold inventory we were seeing in other places.

If you just look at our neighborhoods in Boston, Brookline, Newton, Cambridge, Somerville, and our other local inner suburbs, you realize that there is little opportunity to build vertically (at least for non-uber-high-end housing), and there is virtually no room for sprawl (until you get to the more outlying suburbs). So for property owners, there is built-in value protection over the long run.

So long story short, "normalization" means that there will be less competition for properties (you may even score a great property without any competition!), and less sharp property value inflation. 

Here is the detailed market report for *all* Boston neighborhoods and inner suburbs.

If you have questions about buying or selling Boston real estate, please call me at  617-584-9790, or send me an email at joe.wolvek@gibsonsir.com

Increased Sales & Inventory in Downtown Boston Real Estate Market

We're seeing an increase in residential sales activity in the core downtown Boston market right now. Year to date as of February 21, the number of properties going under agreement is nearly 16% higher than in 2020.Reasons for the increase in sales could include pent-up demand, low interest rates, and the increase in inventory (leading to more choice and less competition for properties you might make an offer on).As of mid-February, downtown Boston inventory of condos and single family homes combined is 37.26% above last year at this time. The chart below, from my latest Boston real estate market report, illustrates the rising inventory in recent years. The current availability of downtown Boston condos and homes is the highest it's been since 2011. Downtown Boston real estate market Higher inventory may be due in part to people who were going to put their properties on market in the spring of 2020 and postponed it until now. And some of the current sellers may be part of the uptick in number of people making a move from downtown to the suburbs.For more details on the downtown market, here's my latest report.If youhavequestions about buying or selling Boston real estate, please call me at617-584-9790, or send me an email via the link below. Boston real estate