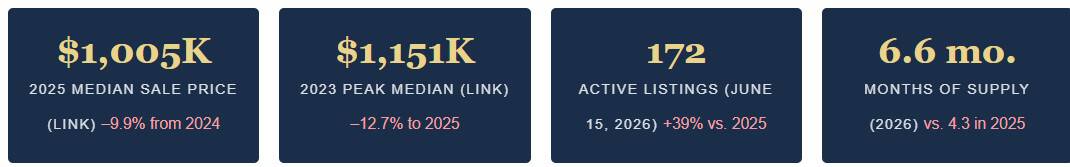
The South End condo market has now spent three consecutive years pulling back from its 2023 price peak. The median sale price, as measured by the Registry of Deeds, rose steadily from $790,000 in 2015 to $1,151,000 in 2023 — then fell to $1,115,000 in 2024 and $1,005,000 in 2025. That's a decline of nearly 13% from the peak, and it's happening against a backdrop of rising inventory and falling transaction volume. The market is clearly repricing.
I have been tracking the South End market for 25+- years. If you are purchasing or selling real estate, it is imperative that you and your Realtor understand the market dynamics at play and behave accordingly.
Mid-Year 2026 Analysis — Eleven-Year Price Perspective
By Joe Wolvek · Gibson Sotheby's International Realty · Data as of June 15, 2026
The Price Picture: From Eleven Years of Context
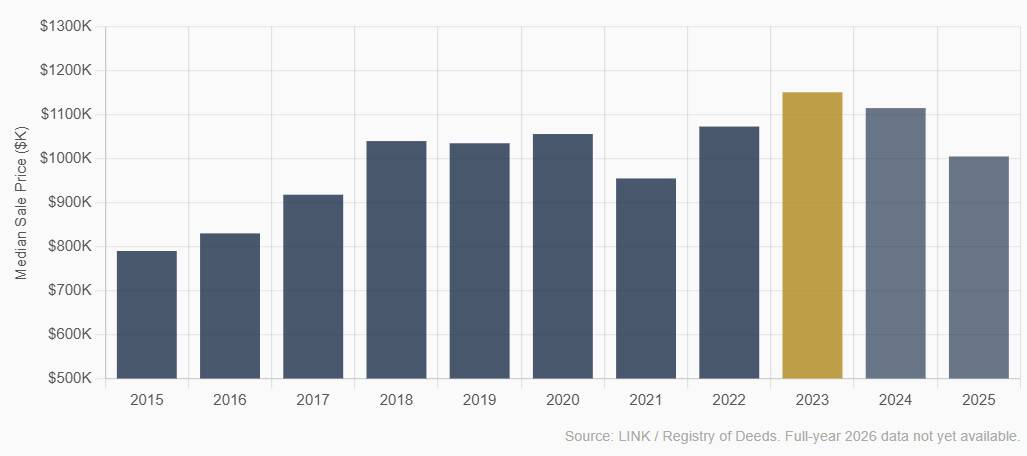
The South End condo market ran one of the longer bull markets in Boston real estate. From 2015 through 2023, the LINK median sale price — sourced directly from recorded deeds and therefore the most complete measure available — rose from $790,000 to $1,151,000, a gain of 46% over eight years. Only 2021 interrupted the trend, dipping to $955,000 in what looks in retrospect like a brief pandemic-era disruption before the market surged to new highs in 2022 and 2023.
Since that 2023 peak, the data tells a consistent story: prices are coming down. The 2024 median of $1,115,000 represented a modest 3.1% pullback. The 2025 median of $1,005,000 — — represents a further 9.9% decline, bringing the cumulative retreat from peak to 12.7%. It is worth noting that we do not yet have a full-year 2026 LINK median figure; that will only be available once the year closes. The 2025 figure is our most recent complete annual benchmark.
Median Sales Price: South End Condos, Annual (LINK/Registry of Deeds)
Condominiums: The Heart of the South End Market
The South End is one of Boston's most condo-centric neighborhoods — a dense, walkable urban district where the overwhelming majority of real estate transactions involve condominium units, from entry-level studios to full-floor luxury homes in landmark brownstone buildings. Single-family activity exists on the margins (fewer than a dozen sales so far this year), so the story of the South End real estate market is, in practice, the story of its condo market.
Inventory: The Defining Trend of 2026
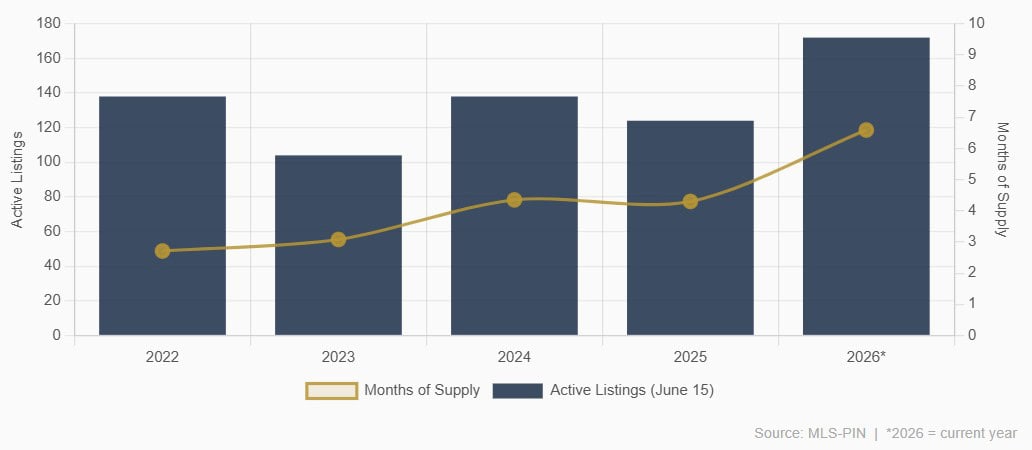
Prices don't fall in a vacuum, and the inventory data makes the mechanism clear. On June 15, 2026, there were 172 active condo listings in the South End — a 39% jump over the 124 units available at the same point last year, and the highest inventory level in this five-year dataset. Months of supply has risen to 6.59 months, well above the 4-month threshold that defines a balanced market.
After years of tight supply (as few as 104 units in June 2023), buyers now have genuine choice. Units that are overpriced or need updating are sitting — the average days-on-market for currently available inventory is 63 days, reflecting a meaningful cohort of listings that have not yet found takers.
Condo Inventory & Months of Supply (June 15 Snapshot; MLS-PIN)
Buyer Demand: A Noticeable Step Back
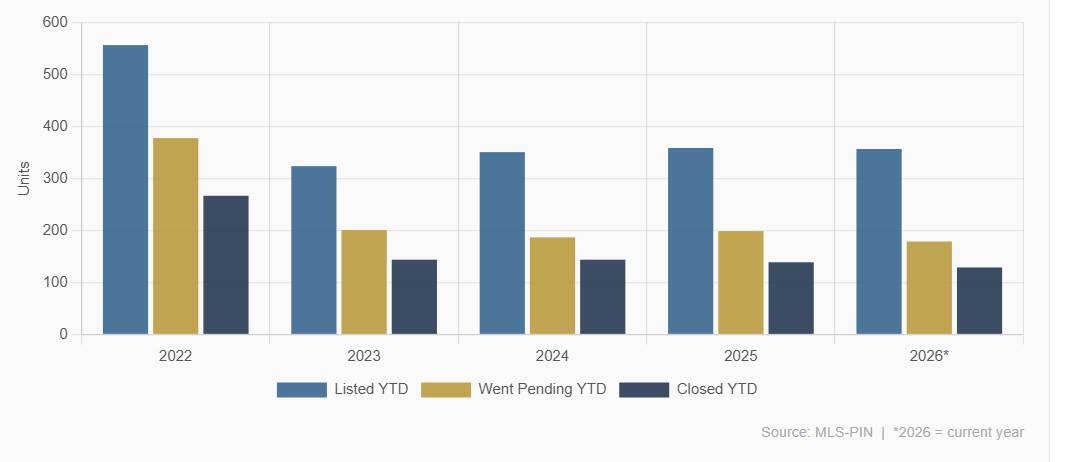
Year-to-date pendings total 179 through mid-June 2026, down about 10% from the 199 recorded at the same point in 2025. The trailing 12-month picture shows 328 units going under agreement, compared to 384 in the prior period — a 15% decline, and part of a multi-year pullback from the 664 pendings recorded in the 12 months ending June 2022.
What's notable is that properties priced correctly are still moving at a reasonable pace. The average days-to-offer for sold condos is 33 days year-to-date — consistent with 2024 and an improvement over 2025's 42 days. The market is not frozen; it's selective.
Once again, it is critical to get good advice backed up by not only general market details, but details of the particular nich that you are in.
Condo Activity YTD (Jan 1-Jun 15)
Price Reductions: Rising Pressure on Sellers
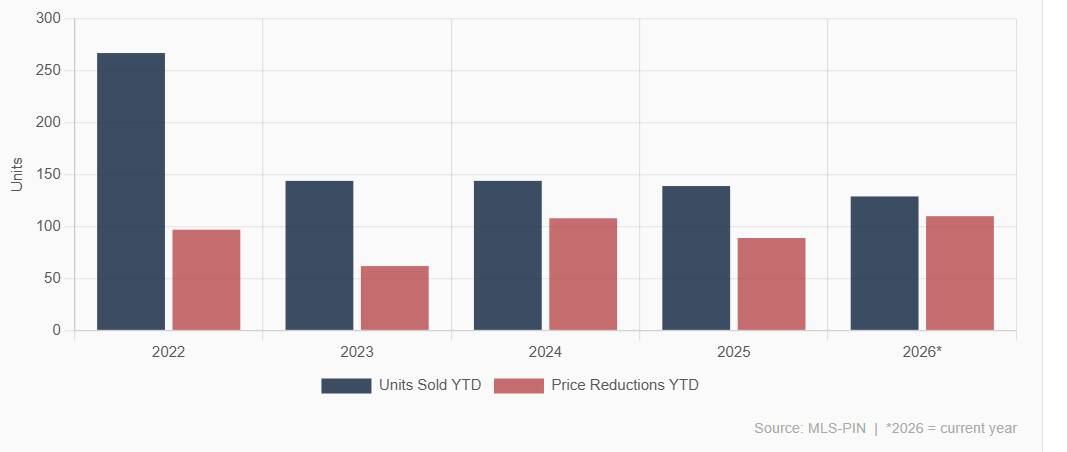
Through mid-June 2026, 110 condo listings have had at least one price reduction — up from 89 in 2025 and the highest YTD count in this five-year dataset. That's roughly 31% of all listings taken this year, compared to 25% a year ago. The pattern is consistent with the LINK price data: sellers are entering the market optimistically and adjusting downward when buyers don't respond. Correct pricing from the start remains the single most important decision a seller can make in this environment.
Price Reductions vs Units Sold YTD (Jan 1-Jun 15)- Condos
Sale-to-List Ratio: Sellers Still Getting Close to Ask
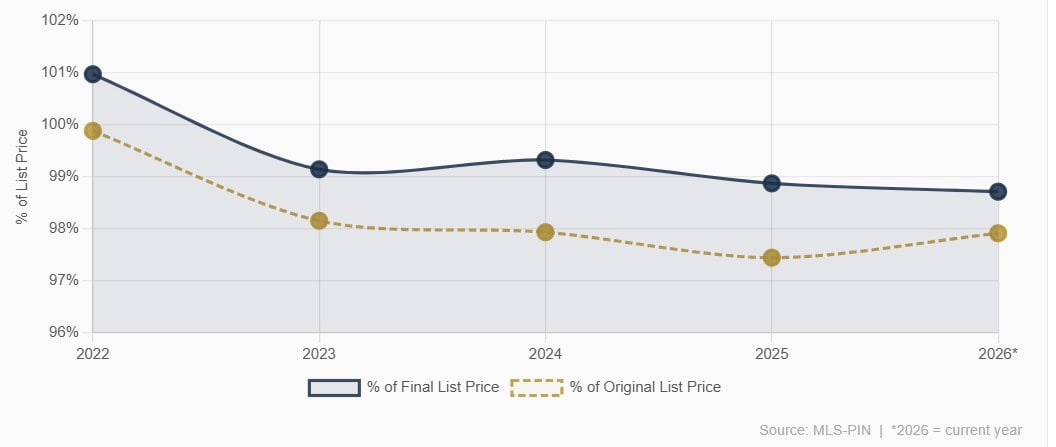
For condos that do sell, sellers are achieving 98.71% of their final list price — virtually unchanged from 98.87% in 2025. This near-stability is actually an encouraging sign: once a property is correctly priced, buyers are not extracting deep closing-table concessions. Price discovery is happening through list price adjustments, not last-minute negotiations. Sale price relative to the original list price is 97.91%, also holding steady.
Sale Price as % of List Price Condos YTD
Days on Market: A Tale of Two Markets
The average days-on-market for sold condos is 52 days through mid-2026 — slightly improved from 55 days in 2025. But active inventory is sitting an average of 63 days, suggesting a growing bifurcation: well-priced, well-presented properties are moving; everything else is accumulating time on market.
The 12-Month View: Volume Keeps Sliding
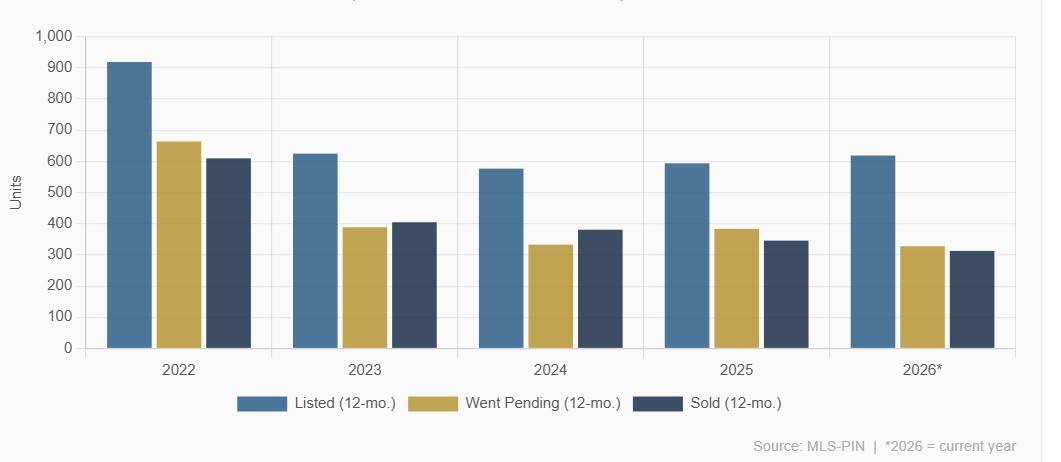
Looking at the full trailing 12 months through June 15, 2026, 313 condos sold — down from 346 in the comparable 2025 period, 381 in 2024, 405 in 2023, and 610 in 2022. That's nearly a 50% reduction in annual transaction volume since the peak. The falling volume and falling prices are two sides of the same coin: elevated interest rates have created a "lock-in effect," where owners who financed at 3% are unwilling to sell and take on a 6–7% mortgage, reducing both the supply of motivated sellers and the pool of move-up buyers.
Trailing 12-Month Condo Volume (Ending June 15)
Single-Family: A Brief Note
Single-family activity in the South End remains thin by design. Through mid-June 2026, just 3 single-family homes have closed (average sale price $3,597,167), compared to 11 in the same period of 2025. Ten single-family homes are currently listed at an average of $4,762,400. These are high-stakes, bespoke transactions that don't lend themselves to broad generalizations; each is essentially its own micro-market.
What Does This Mean for Buyers and Sellers?
For Buyers
The LINK data makes the case clearly: prices have come down 12.7% from the 2023 peak, and the current inventory and demand environment suggests the correction isn't necessarily over. With 172 active listings, buyers have the most selection in years. That said, this is not a distressed market — well-priced properties still attract buyers within a month, and the 2025 median of $1,005,000 still represents a substantial market. Buyers who have been waiting for a more favorable entry point are now in a better position than at any time since 2022.
For Sellers
The market has reset from the 2023 highs, and pricing to that era is the surest way to accumulate days on market. With 31% of listings requiring a price reduction, the cost of overpricing is visible in the data. Sellers who price accurately to current market conditions — using 2025 comparable sales rather than peak-year comps — are still moving their properties and achieving close to 99% of list price.
Condition and presentation remain critical: in a buyer-friendly environment with real alternatives, anything that doesn't show well will be passed over.
Get in touch for solid, experienced advice.
Bottom Line
The South End condo market is in a correction, not a collapse. The LINK median price has fallen from $1,151,000 in 2023 to $1,005,000 in 2025 — a meaningful adjustment that reflects both higher borrowing costs and a structural decline in transaction volume. Inventory is at a five-year high, demand is soft, and sellers who overprice are paying a real time penalty. Yet the correction has been orderly: sale-to-list ratios remain close to par, days-to-offer for sold properties are stable, and there are no signs of distressed selling. This is a market finding a new level — and for buyers willing to engage thoughtfully, it offers the most opportunity since 2021.
Data Sources & Methodology
LINK / Registry of Deeds: Median sale prices and $/SF. Captures all recorded deed transactions — the most complete price measure available, not limited to MLS-listed properties. Annual data; full-year 2026 not yet available.
MLS-PIN: Listings taken, pending counts, inventory, days on market, and sale-to-list ratios. Reflects properties listed and sold through MLS.
YTD figures cover January 1 – June 15 of each respective year. 12-month figures cover the 12 months ending June 15 of each respective year. Report prepared by Joe Wolvek · BostonRealtyWeb.com · June 2026. All information deemed reliable but not guaranteed.